JVM Performance Tuning Tips

JVM Performance Tuning is bit tricky but if done correctly helps a lot to the deployed applications performance.
Introduction To Garbage Collection
-> Performance Problems Due To Garbage Collection
-> Performance Tuning
– Manual
– Automatic
-> Application Monitoring – Garbage Collection Perspective
What is Garbage Collection?
(GC)->
-> GC enables automatic memory recycling
– This part of JVM called the Garbage collector
-> Most collectors are stop-the-world
– Application is paused while the garbage collector runs
-> Generational system
– Young generation
– Old generation
– Permanent generation
Generational Garbage Collection
— Efficient memory re-cycling
– Aging of objects
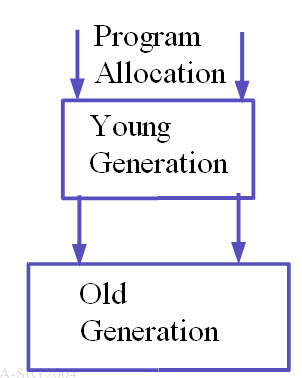
 Objects are allocated by the program in the young generation
Young Generation constantly filters out most objects (2/3), moves the rest to old generation (promotion)
Old generation reclaims objects once in a while
Two Types Of Collectors
– For applications where pause is a criteria, like Real Time Applications (telco), VoIP, Call Centers (Response time), Front Ends (GUI)
-> Throughput Collectors
– For enterprise applications where pause is not such a criteria, like Financial systems, Application Servers, Billing Systems, Health Care, Decision Support Systems
Low Pause Collectors
– to serve the needs of applications where pause is a criteria
-> Parallel Copy Collector
– Use many threads to process young generation collection
– Still stop-the-world
– Cost of collection is now dependent on live data and number of CPUs (single threaded pause / CPUs)
-> Concurrent Old Generation Collector
– Use one thread to process collection while application threads run on remaining CPUs
– Cost is a percentage of CPU
Throughput Collectors
– serve the needs of enterprise applications where pause is not such a criteria
-> Parallel Throughput Collector
– Uses many threads to process young generation collection
– Works very well with large young generation heaps, and lots of CPUs
– Still, stop-the-world collection
– Cost of collection is dependent on live data and CPUs
-> Mark-Compact Old Generation Collector
– Uses one thread to process collection
– Stop-the-world collection
Throughput Collectors
Heap Layout For The Collectors
-> Low Pause Collectors
– Smaller young generations and larger older generations
– Keep young generation pause low
– Old generation concurrent collection pause should be low
-> Throughput Collectors
– Larger young generations, and smaller old generations
– Young generation pause is dependent on number of CPUs
– Old generation pause could be big, so keep old generation small, to hold only needed long term objects
Performance Problems Due To Garbage Collection
Problems of Garbage Collection
-> Application is paused during GC
– Adds latency
-> High GC sequential overhead (serialization) leads to low throughput
– Limits efficiency and scalability of most server applications
-> GC pauses make application behavior non-deterministic
Client Side Problems
Applications like mobile and desktop GUIs (thick and thin client)
-> Requirements
– fast response times
– very low pause time
-> Problems
– default collector used most of the time
– heaps not sized
– applications run with defaults
– 1 or 2 CPUs, less memory
-> See
– GC frequency increase as heap fills up faster
– GC takes over application time, leading to performance problems
Server Side Problems (1)
Serving Front end and Back end applications
-> Requirements
– Front end applications – application servers, call- processing, web applications
-> fast response time to interact with users
-> low pause time
– Backend applications – MOMs, Billing, Financial, DSS
-> throughput based applications, no interaction with users
-> tolerate higher pauses, need more application time
– Lots of CPUs, and memory
Server Side Problems (2)
Serving Front end and Back end applications
In case of any ©Copyright or missing credits issue please check CopyRights page for faster resolutions.

