Monitoring weblogic servers health

There are few things which a wl admin should look at and make sure the application managed server health is good enough for smooth processing of application processes.
System level check:
log level:
- Always keep a check on log files. i.e *.out and *.log files in managed servers.
- create a cronjob and a shell script to check for “[STUCK] ExecuteThread:” in *.log file and when ever the term matches send a mail to admin or a group who can check the status of STUCK threads.As if time passes and many stuck threads appear with out getting “unstuck” then there is a risk to application functionalities. default StuckThreadMaxTime is 600 secs which can be changed accordingly if its known that the processing takes more time.
STUCK thread log:
####<Aug 16, 2011 8:03:34 PM EDT> <Error> <WebLogicServer> <corp.techpaste.com> <server-techpaste1-p881> <[ACTIVE] ExecuteThread: '13' for queue: 'weblogic.kernel.Default (self-tuning)'> <<WLS Kernel>> <> <> <1313539414049> <BEA-000337> <[STUCK] ExecuteThread: '8' for queue: 'weblogic.kernel.Default (self-tuning)' has been busy for "608" seconds working on the request "weblogic.servlet.internal.ServletRequestImpl@576e11[
]", which is more than the configured time (StuckThreadMaxTime) of "600" seconds. Stack trace:
####<Aug 16, 2011 8:04:34 PM EDT> <Error> <WebLogicServer> <corp.techpaste.com> <server-techpaste1-p881> <[ACTIVE] ExecuteThread: '7' for queue: 'weblogic.kernel.Default (self-tuning)'> <<WLS Kernel>> <> <> <1313539474055> <BEA-000337> <[STUCK] ExecuteThread: '8' for queue: 'weblogic.kernel.Default (self-tuning)' has been busy for "668" seconds working on the request "weblogic.servlet.internal.ServletRequestImpl@576e11[
]", which is more than the configured time (StuckThreadMaxTime) of "600" seconds. Stack trace:
STUCK thread getting unstuck:
####<Aug 16, 2011 8:11:39 PM EDT> <Info> <WebLogicServer> <corp.techpaste.com> <server-techpaste1-p881> <[STUCK] ExecuteThread: '8' for queue: 'weblogic.kernel.Default (self-tuning)'> <<WLS Kernel>> <> <> <1313539899519> <BEA-000339> <[STUCK] ExecuteThread: '8' for queue: 'weblogic.kernel.Default (self-tuning)' has become "unstuck".>
Above are the logs you get when a thread goes stuck or not responsive for 600seconds, then weblogic marks then as STUCK which eventually should get unstuck as in the above log. These errors should be kept in check to avoid issues in applications.
If too many stuck threads appear and do not clearup then may be we need to restart the managed server to clear all stuck threads. Post this we need to make sure all application level tuning is done like DB queries optimisation, network connectivity etc.
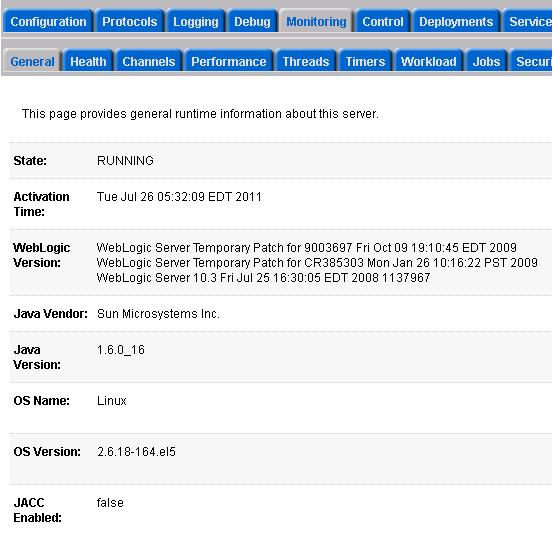
- In weblogic console go to Home >Summary of Servers >Managed server> Monitoring tab and check for below details
- In General tab check for the server state “RUNNING” or not.

- In Health Tab make sure all applications deployed – subsystem health is OK and green like below.

- In Performance tab make sure Heap Free Percent is well above, if you find it very low like below 20%(for longer period of time) then you may need to restart or do a garbage collection to free up old objects in JVM

- In threads tab make sure health is OK and there are no stuck threads i.e stuck status=false like below.


- In work load tab make sure pending requests are not too many, else you need to look at the number of work managers and there health and work done.

- Check JMS connections are not too high.

- on JDBC tab make sure all datasources are in RUNNING state.

- In JTA tab make sure Transaction total count =< Transactions committed total count

In case of any ©Copyright or missing credits issue please check CopyRights page for faster resolutions.
Excellent post..Thanks Alot for your valuable time to posting this topic.
Glad it helped you!!
Thanks,
TechPaste