weblogic.socket.MaxMessageSizeExceededException | Weblogic

At a customer place we saw the managed server getting stuck and hung with below MaxMessageSizeExceededException errors in logs. So we followed below steps to narrow down the errors and fix it.
Once this error shows up the managed server which is sending this info to admin server usually gets out of sync and the admin server fails to determine the status of the managed server and eventually it looses the connectivity to admin server.
####<May 16, 2013 12:13:11 PM CEST> <Error> <Socket> <kihjja> <prod01_AdminServer> <ExecuteThread: ‘2’ for queue:
‘weblogic.socket.Muxer’> <<WLS Kernel>> <fsa322as2a1ad39a:e8f504c:13e8cebfw21:-8000-000000000000038d>
<1368699191244> <BEA-000403> <IOException occurred on socket:Sockethttp://addr=kihjja-ip/11.32.89.30,port=8009,localport=9379
weblogic.socket.MaxMessageSizeExceededException: Incoming message of size: ‘27002222’ bytes exceeds the configured maximum of: ‘25000000’ bytes for protocol: ‘t3’.
weblogic.socket.MaxMessageSizeExceededException: Incoming message of size: ‘27002222’ bytes exceeds the configured maximum of: ‘25000000’ bytes for protocol: ‘t3’
at weblogic.socket.BaseAbstractMuxableSocket.incrementBufferOffset(BaseAbstractMuxableSocket.java:230)
at weblogic.rjvm.t3.MuxableSocketT3.incrementBufferOffset(MuxableSocketT3.java:351)
at weblogic.socket.SocketMuxer.readFromSocket(SocketMuxer.java:991)
at weblogic.socket.SocketMuxer.readReadySocketOnce(SocketMuxer.java:922)
at weblogic.socket.SocketMuxer.readReadySocket(SocketMuxer.java:899)
at weblogic.socket.EPollSocketMuxer.dataReceived(EPollSocketMuxer.java:215)
The messages are sent once in every 4-6 minutes or so. It looked like an issue with a periodic heartbeat message that is being sent through to the admin server but there were no custom settings defined to send heartbeat each 5 or 6 mins.
Sometime we also saw an OutOfMemory Error happening at the managed server end which is sending these message.
We used below debug flags to narrowdown the issue. This requires a restart of managed server and admin server to take effect.
-Dweblogic.kernel.debug=true
-Dweblogic.debug.DebugMessaging=true
-Dweblogic.debug.DebugConnection=true
The message that was 26 MB long was captured in the managed server logs and it outputs the following information for the header.
Sending JVMMessage from: ‘-2251529234702393834S:voids-ullq:voids-ullq2:8123,voids-ullq:8123:domServiceBus:AdminServer’ cmd: ‘CMD_RESPONSE’, QOS: ‘101’, responseId: ’37’, invokableId: ’37’, flags: ‘JVMIDs Not Sent, TX Context Not Sent, 0x10’, abbrev offset: ‘1430549’
While searching through the config we found a WLDF Diagnostics Module in the environment with the following configuration.
<wldf-system-resource>
<name>Module-FMWDFW</name>
<target>tpciocluster,AdminServer</target>
<descriptor-file-name>diagnostics/Module-FMWDFW-1132.xml</descriptor-file-name>
<description>Creates FMWDFW incidents based on unchecked Exceptions and critical errors</description>
</wldf-system-resource>
After much searching on google we found out from oracle docs that Fusion Middleware configures a WLDF Diagnostics Module that contains a set of Watch and Notification rules for detecting a specific set of critical errors and creating an incident for each occurrence of those errors.
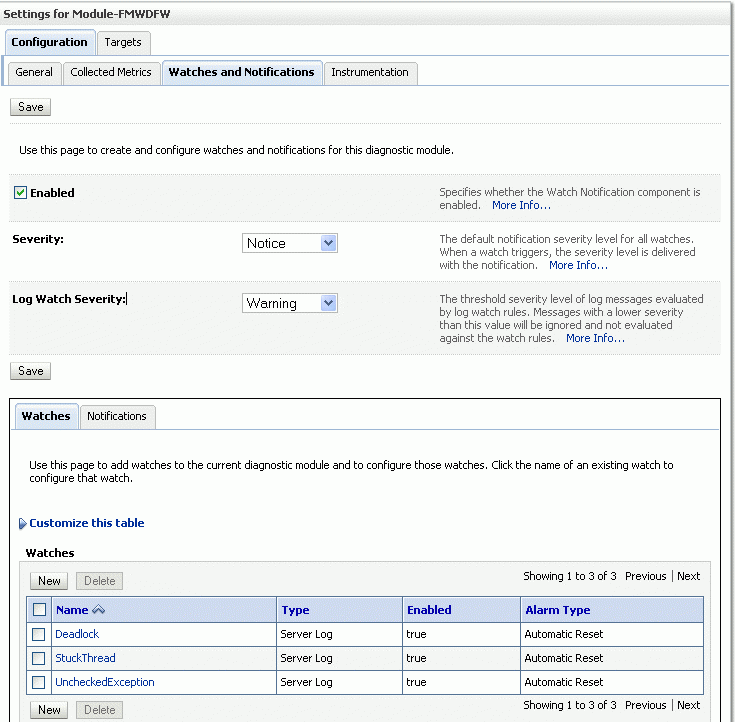
The module is called Module-FMWDFW. It contains the following set of watch conditions.
1. Deadlock
2. Stuck Thread
3. Unchecked Exception.
This module was causing the MaxMessageSizeExceededException errors in logs, so we disabled it and the issue got resolved.
Please follow below steps to disable the module with ease.
1. Login to Admin Console with weblogic Admin user.
2. In the Change Center, click Lock & Edit.
3. In the left pane, expand Diagnostics and select Diagnostic Modules.
4. Click Module-FMWDFW.Which displays the Settings for Module-FMWDFW page.
5. Select the Watches and Notifications tab, which is shown in the following figure:
6. Uncheck the Enable checkbox to diable it and click on save button.
7. Release the lock and edit to activate the changes
***In production environment it is not recommended to have diagnostic watches configured.
In case of any ©Copyright or missing credits issue please check CopyRights page for faster resolutions.
